Chilean economic indicators that always load
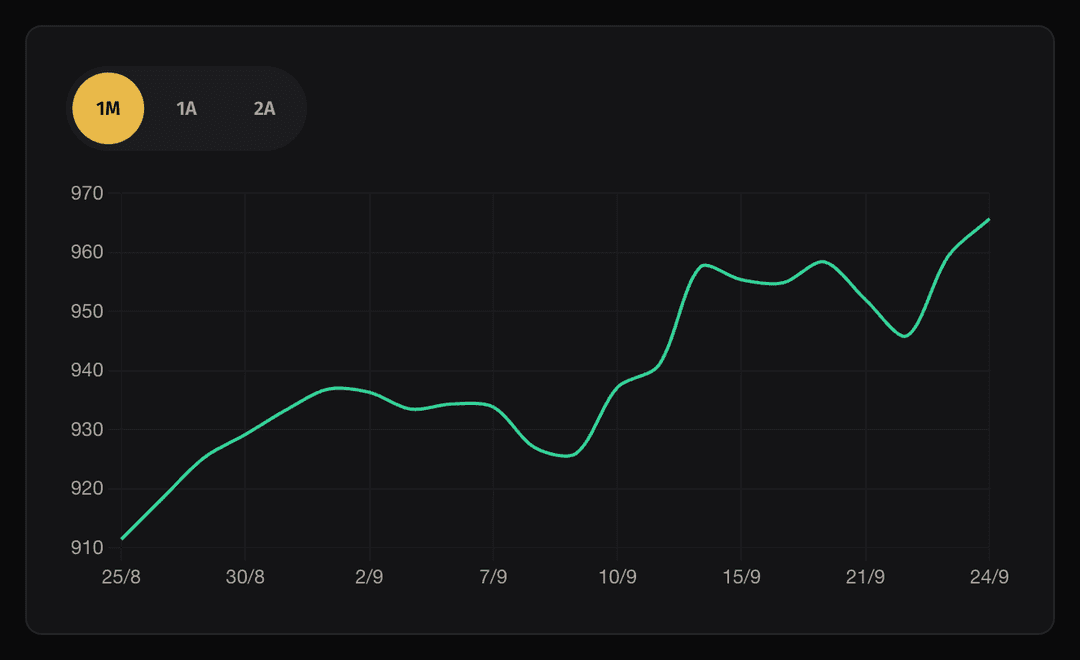
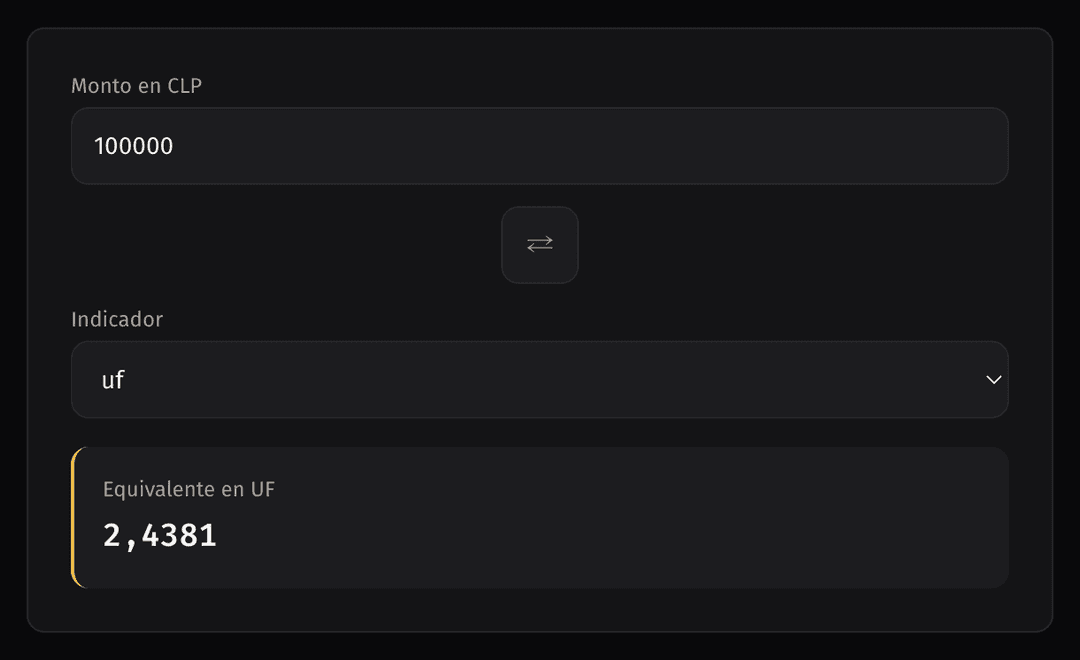
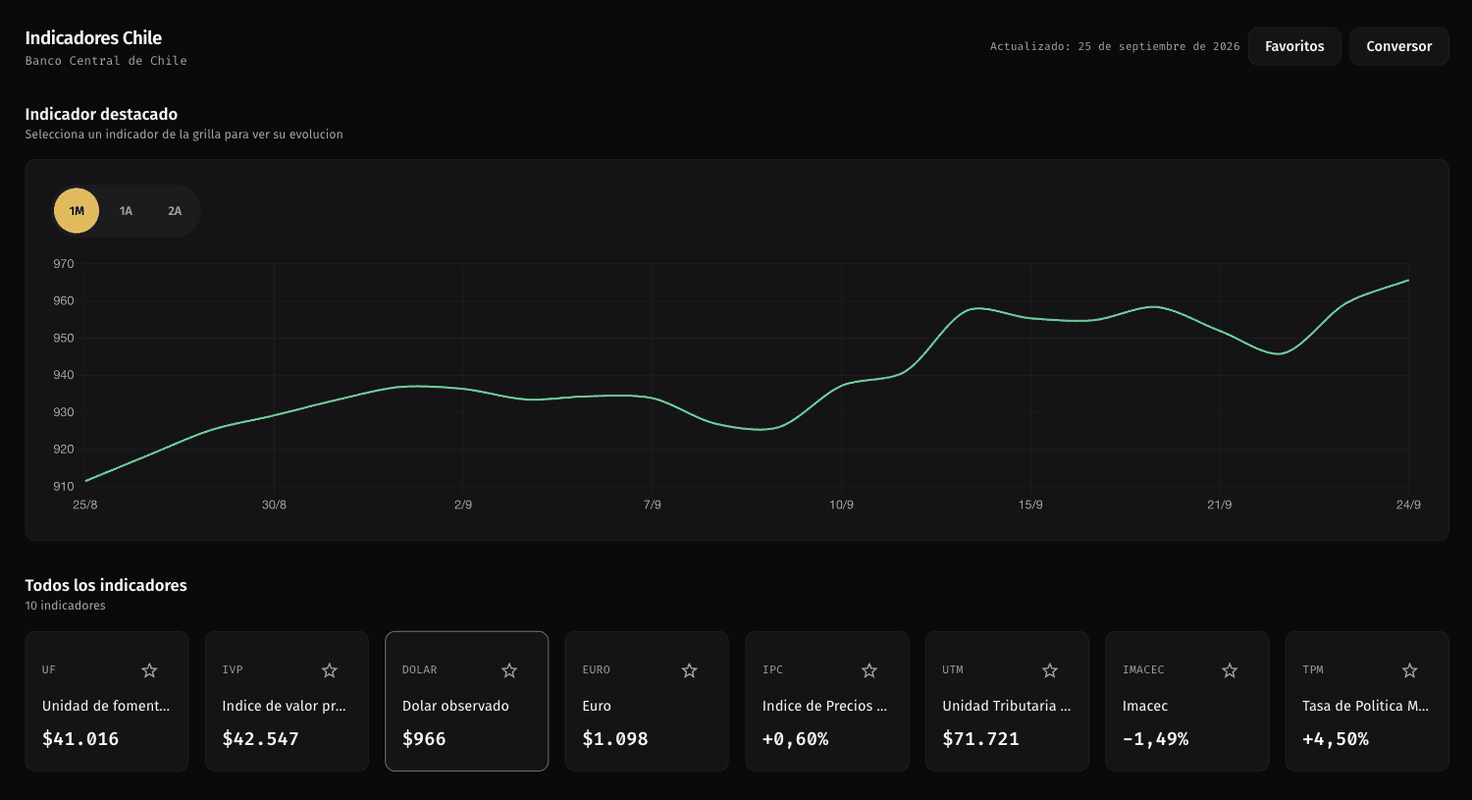
Pulso shows 10 indicators of the Chilean economy in near real time (UF, dollar, euro, CPI, UTM, Imacec, policy rate, copper, IVP and unemployment) with a grid, a historical chart, favorites and a peso converter. Behind it sits its own API, the only piece that talks to the Central Bank.
- Stack
- Next.js 16 (App Router), React 19, TypeScript, SWR, Chart.js
- Quality
- Vitest, Playwright (E2E), CI on GitHub Actions, deployed on Vercel
- Role
- Everything: product, architecture, backend and frontend
The problem
The first version used mindicador.cl, and in production it sometimes just didn't load. The Central Bank's official API is stable, but it isn't meant to be called from the browser: if every visitor requested the 10 indicators and their history, the calls would multiply with only a handful of users.
The decision
I built my own intermediate API: the frontend only talks to it, and it's the only thing that calls the Central Bank, with in-memory caching and a per-indicator fallback, so if one indicator fails the other nine still load.
The result
Parallelizing the 10 calls to the Central Bank cut load time from about 19 seconds to 0.23. From then on, parallelism became an architectural requirement rather than an optimization.